

手元のコードのパフォーマンスを計測するperformance.markのスニペット
一部の機能をパフォーマンス改善したときにそれを計測したり、データを集めたいときがあります。 しかし、それだけのためにライブラリを追加するのも面倒くさい(実装後に計測コードは外すので)し、コンソールに結果を出すのもデータ収集的にイマイチです。
// よくあるコンソールに表示するパフォーマンス計測コード
const start = performance.now();
// ------------
// 計測したい処理を書く
// ------------
console.log(`${performance.now() - start}ms`);
結果をコピーしてSpreadSheetなどで可視化できたり、処理時間と関連する要素も保存しておきたいです。 (コンソールに出力すると埋もれたり、加工がめんどうです)
そのようなときによく使っているPerformance.mark()とPerformance.measure()を使ったスニペットを作りました
- リポジトリ: azu/performance-mark-snippet: Minimum
performance.marksnippet for measure a feature with meta data.
performance.mark APIについては次の記事を参考にしてみてください。
スニペット
最新のスニペットはazu/performance-mark-snippetの方を参照してください。
スニペットはmark関数を定義しているだけです。
使いたいところでこのスニペットを埋め込んで利用できます。
/**
 * start to mark with `name` and return markEnd function that end to mark with details data
 * @param {string} name
 * @returns {Function} markEnd function
 */
const mark = (name) => {
    const currentId = window.__performance_mark_snippet_id || 0;
    window.__performance_mark_snippet_id = currentId + 1;
    const markName = name + "::start" + currentId;
    performance.mark(markName);
    return function markEnd(details) {
        performance.mark(name + "::end" + currentId);
        performance.measure(name + "::" + currentId, name + "::start" + currentId, name + "::end" + currentId);
        if (details) {
            const map = window.__performance_mark_snippet_map || new Map();
            map.set(name + "::" + currentId, details);
            window.__performance_mark_snippet_map = map;
        }
    }
}

// 使い方の例
const markEnd = mark("label");
// ...
// ...Do something to measure...
// ...
markEnd({ key : "value" });
使い方
使うときは、mark関数を呼び出すとmarkEnd関数を返します。
mark関数を呼び出してから、markEnd関数を呼び出すまでの時間が計測時間になります。
mark関数には計測区間のラベルを渡すmarkEnd関数には関連付けたい任意のデータを渡す(渡さなくてもいいはず)
const markEnd = mark("label name");
// ...
// ...計測したい処理
// ...
markEnd({ key : "value" }); // 引数には計測に紐づけたい任意のデータを渡す。
// markEnd(); // 処理時間だけなら引数はいらない
計測した結果はすべてperformance.measureに保存されるので、performance.getEntries()で取り出せます。
また、markEndで紐づけたデータはwindow.window.__performance_mark_snippet_mapのMapオブジェクトに保存されています。
次のスニペットを計測後に実行すれば、console.tableでデータを一覧できます。
結果をStore as global variableで変数に保存してcopy(temp1)などでコピーすると便利です。
console.table(Array.from(performance.getEntries()).filter(entry => entry.entryType === "measure").map(entry => {
  return { name: entry.name, "duration(ms)": entry.duration, ...window.window.__performance_mark_snippet_map.get(entry.name) };
}))
例
/**
 * start to mark with `name` and return markEnd function that end to mark with details data
 * @param {string} name
 */
const mark = (name) => {
    const currentId = window.__performance_mark_snippet_id || 0;
    window.__performance_mark_snippet_id = currentId + 1;
    const markName = name + "::start" + currentId;
    performance.mark(markName);
    return function markEnd(details) {
        performance.mark(name + "::end" + currentId);
        performance.measure(name + "::" + currentId, name + "::start" + currentId, name + "::end" + currentId);
        if (details) {
            const map = window.__performance_mark_snippet_map || new Map();
            map.set(name + "::" + currentId, details);
            window.__performance_mark_snippet_map = map;
        }
    }
}

// ランダムな処理時間を10コ計測してる
for (let i = 0; i < 10; i++){
  setTimeout(() => {
    const markEnd = mark(`label ${i}`);
    setTimeout(() => {
      markEnd({ index : i });
    }, Math.random() * 1000);
  }, Math.random() * 1000);
}
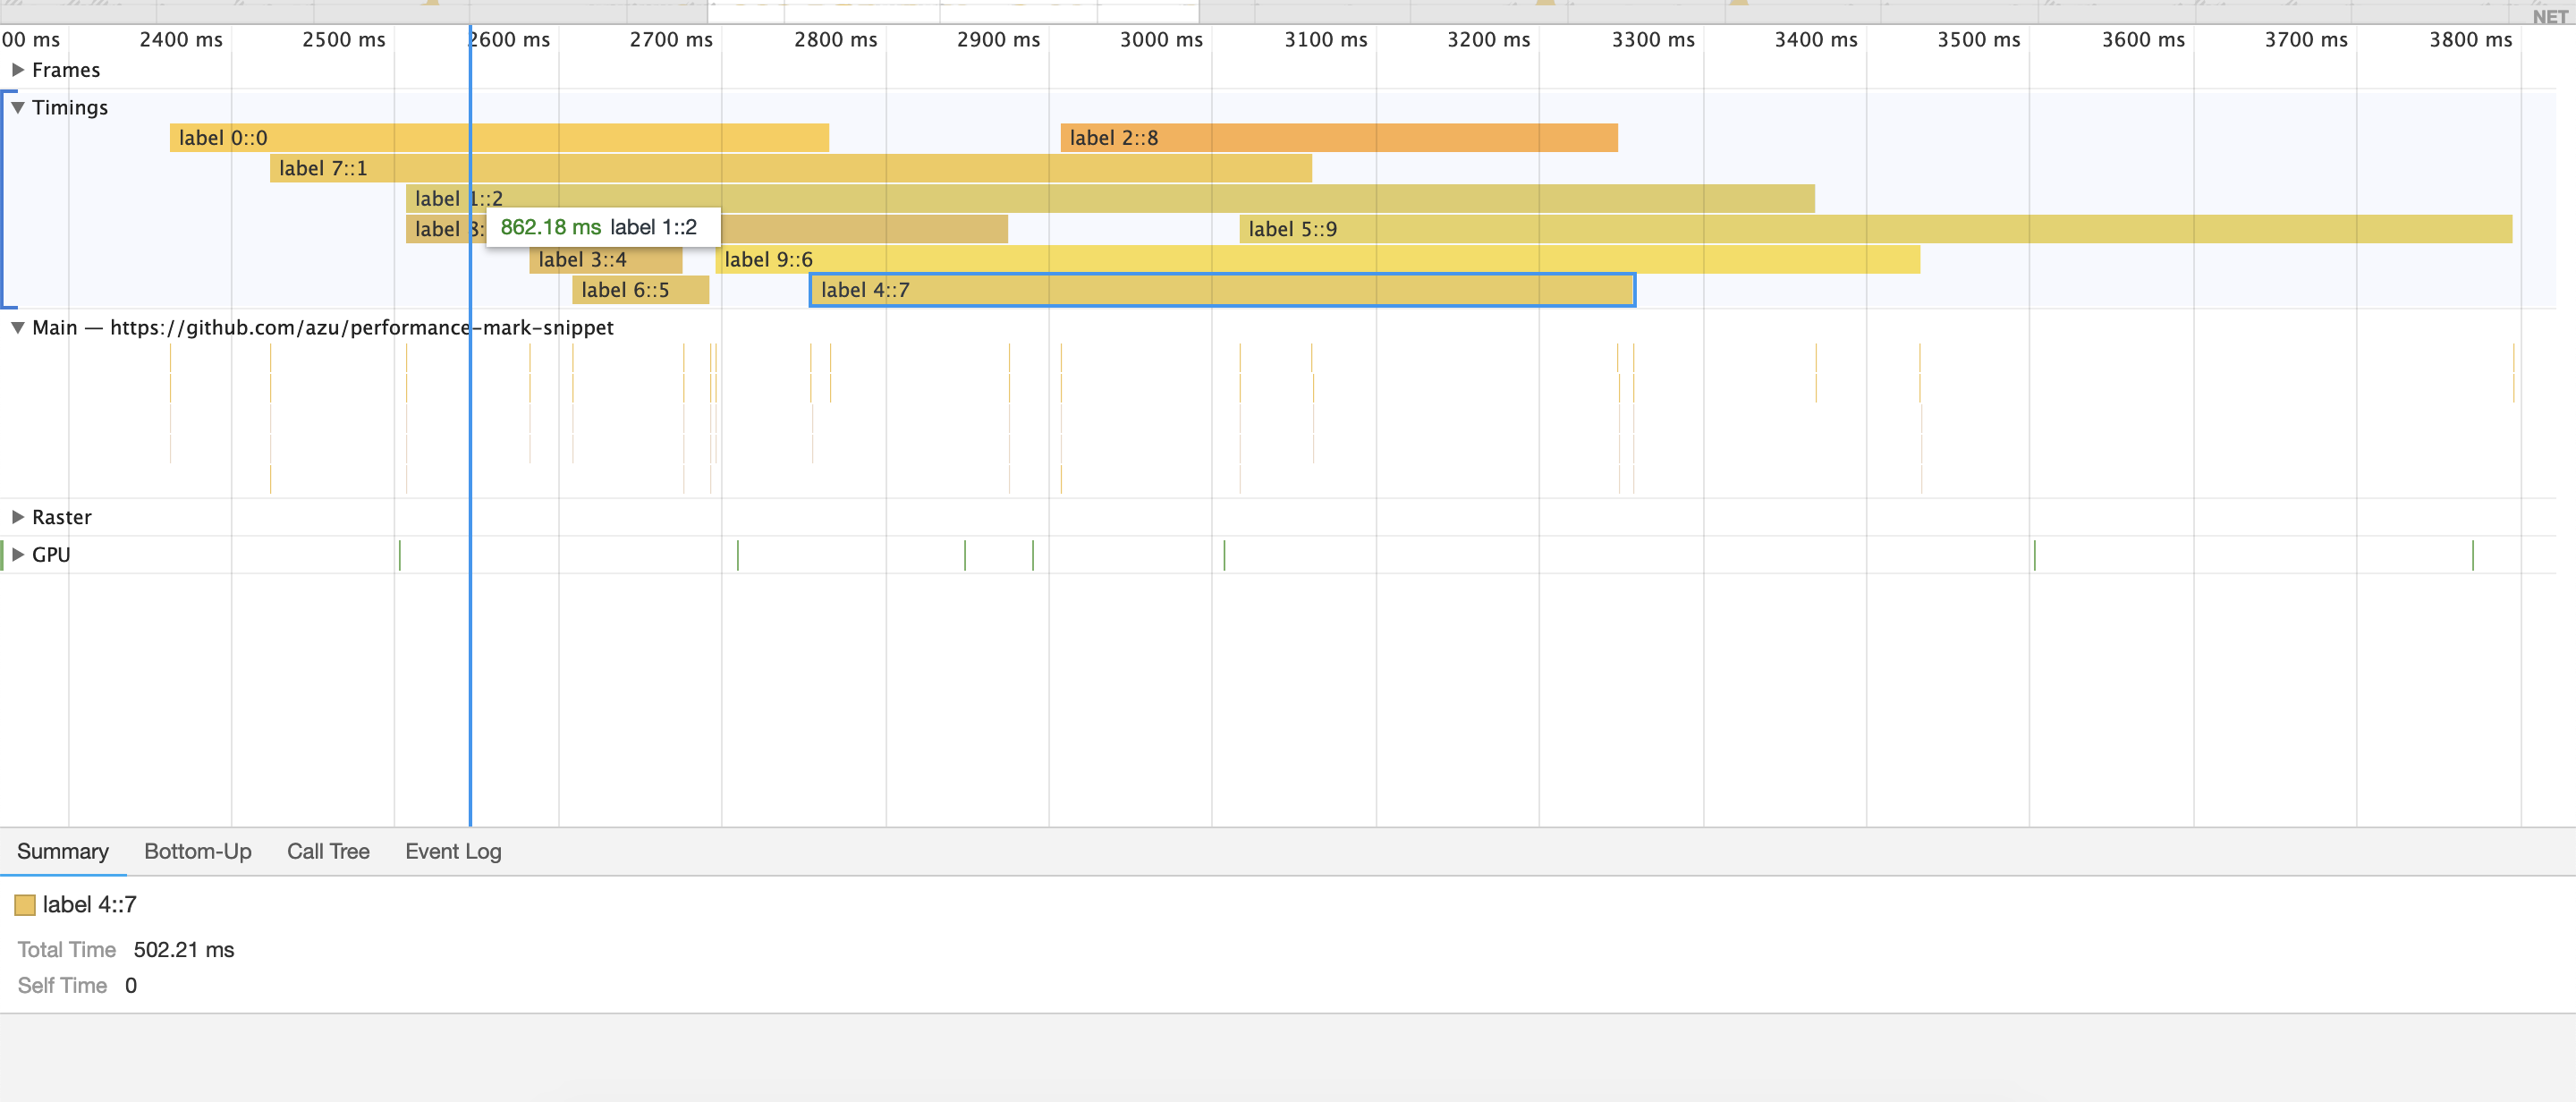
結果はパフォーマンスタブで記録しているなら、User Timingにラベル付きで表示されます。
また、先程の収集スニペットを実行すればconsole.tableで一覧できます。
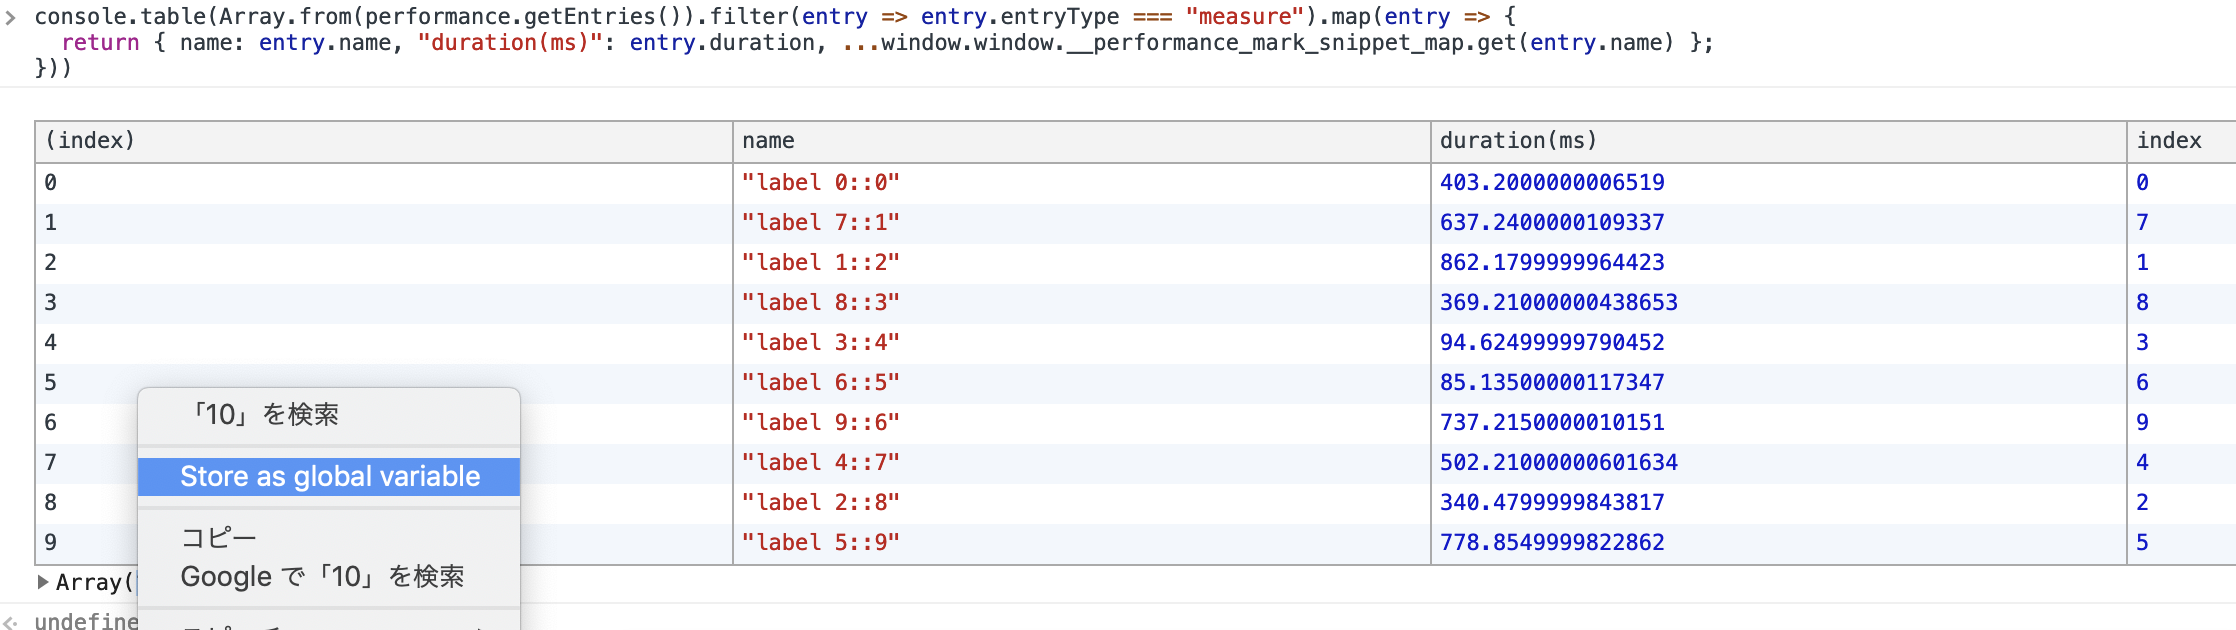
ChromeならArray(10)とかの部分を右クリックでStore as global variableで変数に保存して、copy(temp1)などでコピーできます。
temp1
//(10) [{…}, {…}, {…}, {…}, {…}, {…}, {…}, {…}, {…}, {…}]
temp1[0]
// {name: "label 0::0", duration(ms): 403.2000000006519, index: 0}
copy(temp1)
結果のデータ
[
  {
    "name": "label 0::0",
    "duration(ms)": 403.2000000006519,
    "index": 0
  },
  {
    "name": "label 7::1",
    "duration(ms)": 637.2400000109337,
    "index": 7
  },
  {
    "name": "label 1::2",
    "duration(ms)": 862.1799999964423,
    "index": 1
  },
  {
    "name": "label 8::3",
    "duration(ms)": 369.21000000438653,
    "index": 8
  },
  {
    "name": "label 3::4",
    "duration(ms)": 94.62499999790452,
    "index": 3
  },
  {
    "name": "label 6::5",
    "duration(ms)": 85.13500000117347,
    "index": 6
  },
  {
    "name": "label 9::6",
    "duration(ms)": 737.2150000010151,
    "index": 9
  },
  {
    "name": "label 4::7",
    "duration(ms)": 502.21000000601634,
    "index": 4
  },
  {
    "name": "label 2::8",
    "duration(ms)": 340.4799999843817,
    "index": 2
  },
  {
    "name": "label 5::9",
    "duration(ms)": 778.8549999822862,
    "index": 5
  }
]
後はJSON To CSVするなりして、SpreadSheetで可視化したりすると良いです。 可視化にはhttps://plot.ly/などを使うとJavaScriptで処理もできるので便利です
おわりに
1つのPull Requestだすのに大掛かりな仕組みは導入したくないので、こういうスニペットを使うことがあります。
今は関連データをwindowに入れていますがUser Timing Level 3では、performance.mark(name, startTime, details)とdetailsに関連データを保存できるようになるのでもう少しましになると思います。
- 追記(2019-12-31): User Timing L3 - Chrome Platform StatusがChrome 78で実装されました
peformance.markを使ってマーキングとデータの回収の2フェーズに分けると計測がかなり楽になるのでおすすめです。
常時計測するなら、DataDogなどのそれ系のサービスは大体似たようなロギングの仕組みがあるのでそちらを使いましょう。
お知らせ欄
JavaScript Primerの書籍版がAmazonで購入できます。
JavaScriptに関する最新情報は週一でJSer.infoを更新しています。